The Osmosis Resource Efficiency Smart Beta Fund* has passed its 3-year anniversary, a key milestone in a Fund’s history.
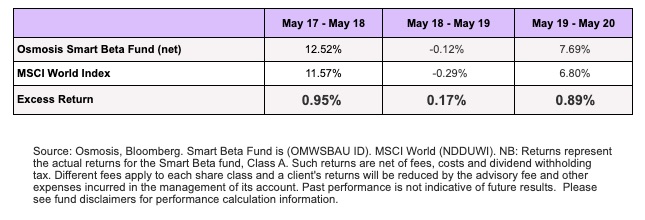
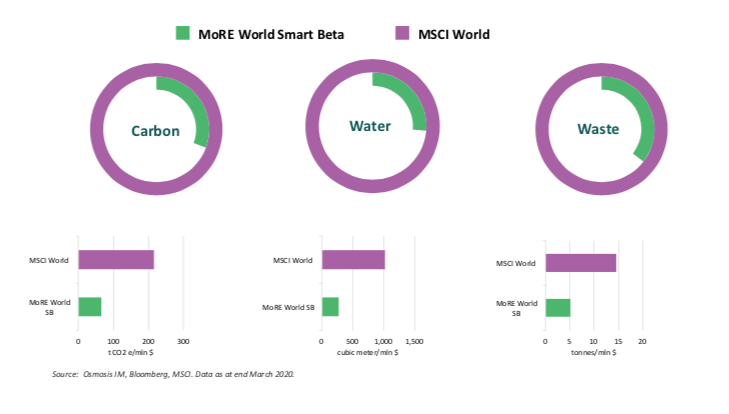
Over this period the Fund has delivered annualised outperformance of 0.65% (net of all fees) with a tight tracking error to the MSCI World, while simultaneously reducing ownership of carbon, water and waste by an average of 65%.**
Annual Returns since Inception (31 May 2017)

Annual Returns since Inception (31 May 2017)

The Smart Beta Fund launched following extensive research, correlation and attribution analysis on our proprietary Resource Efficiency Factor. At inception, we believed that if we could prove out the performance opportunity over an initial 3-year period, then the fund could become a viable, sustainable replacement product for an existing MSCI World exposure.
The Fund, initially seeded by a large European foundation, has now attracted investors from as far afield as Brazil. We would like to thank those investors, who have continued to support it, for their belief in the investment thesis and confidence in the company.
As pressure grows to adopt longer-term thinking and a more meanings-based approach to investment, it is vital for the team at Osmosis to continue to evidence that investing sustainably should not come at the cost of returns. This three year track record, delivered through some extraordinary market environments, further supports our investment thesis that those companies which consume less energy and water, and produce less waste relative to value creation are, all else equal, better-managed companies, and capable of generating greater shareholder value. The Fund also excludes tobacco companies and those companies in breach of the UN global compact, further enhancing its values proposition.
As the firm has scaled in size, we have enacted an active engagement program focussed on our core area of expertise, environmental disclosures. Encouraging companies to report and improve their environmental disclosures is now a key part of our investment process. We regularly engage with companies to better understand the materiality, context and accuracy of their data. A company that discloses its environmental footprint is more likely to manage, measure and reduce its impact.
Fund AUM is currently at ~$500m, and the Fund is daily traded in a UCITS vehicle with multiple share classes and a low TER. We hope that investors who are currently reviewing portfolios and evaluating their approach to sustainability will join Osmosis on the next part of our journey. We welcome these conversations.
* This Fund is not available to US investors. Separate accounts are available for US investors using the same model and investment objective of the Fund.
** The foot printing metrics above have been calculated using a Total Metrics approach, apportioning carbon emissions, water consumption and waste generation to the investor based on an equity ownership perspective. Calculating the “owned” emissions, water and waste from each position in the portfolio and benchmark, and adding those metrics yields the total impacts for the portfolio. The calculations have been based on metrics recorded in the MoRE DataBase where available, and industry averages have been used to estimate any gaps in the data coverage.
Performance. NO REPRESENTATION IS BEING MADE THAT ANY ACCOUNT WILL OR IS LIKELY TO ACHIEVE PROFIT OR LOSSES SIMILAR TO THOSE SHOWN.
An investor’s actual account is managed by Osmosis based on the strategy, but the actual composition and performance of the account may differ from those of the strategy due to differences in the timing and prices of trades, and the identity and weightings of securities holdings.
Past performance may not be indicative of future results. Different types of investments and/or investment strategies involve varying levels of risk, and there can be no assurance that any specific investment or investment strategy will be profitable. No current or prospective client should assume that future performance will be profitable, equal the performance results reflected, or equal any corresponding historical benchmark index. For reasons including variances in fees, differing client investment objectives and/or risk tolerance, market fluctuation, the date on which a client engaged Osmosis’s services, and any account contributions or withdrawals, the performance of a specific client’s account may have varied substantially from the referenced performance results. In the event that there has been a change in a client’s investment objectives or financial situation, the client is encouraged to advise us immediately. It is important to remember that the value of investments, and the income from them, can go down as well as up and is not guaranteed and that you, the investor, may not get back the amount originally invested. Any forecast, projection or target where provided is indicative only and is not guaranteed in any way. Osmosis accepts no liability for any failure to meet such forecast, projection or target. Past performance is not an indication of future performance.
Net Performance. Net returns are net of fees and in USD unless indicated otherwise. Net returns are net of fees, costs and dividend withholding tax. Different fees may apply to a client’s account and a client’s returns may be further reduced by the advisory fee and other expenses incurred in the management of its account. Please see the specific performance disclosure under each slide for additional details. Our fees are fully disclosed in Part 2A of Form ADV and may be updated from time to time.
The historical index performance results for all benchmark indexes do not reflect the deduction of transaction, custodial, or management fees, the incurrence of which would have the effect of decreasing indicated historical performance results. Indexes are unmanaged and are not available for direct investment. The historical performance results for all indices are provided exclusively for comparison purposes only, and may or may not be an appropriate measure to provide general comparative information to assist an individual client or prospective client in determining whether Osmosis performance meets, or continues to meet, his/her investment objective(s). The referenced benchmarks may or may not be appropriate benchmarks against which an observer should compare our returns.
The MSCI World Index captures large and midcap representation across 23 Developed Market


