The best time to invest in the environment was yesterday, the second-best time is now
In 2019 the UN Environment Programme published a report warning that a 7.6% year-on-year reduction in global greenhouse gas emissions is required between 2020 and 2030[1] to align with the ‘well below 2°C, preferably 1.5°C’ warming outlined in the Paris agreement. While significant reductions in carbon emissions are of utmost importance, the reduction path that companies take to reach this goal is arguably more so. As an industry, we must remember that reductions made now are far more significant to the health of our planet than reductions made in the future.
“Any further delay in concerted anticipatory global action on adaptation and mitigation will miss a brief and rapidly closing window of opportunity to secure a liveable and sustainable future for all”
IPCC Climate Change report 2022
n analogy often used in climate science is that of filling a bathtub. The volume of the bathtub is the ‘carbon budget’: in this case the amount of carbon released that would warm the earth by 1.5 degrees. The flow of the ‘tap’ shows the rate of carbon emissions into the atmosphere and the water leaving through the drain represents carbon capture. The lesson from the bathtub analogy is obvious: don’t let it overflow. Currently, the global focus is on reaching net zero by 2050 by closing the tap. Whilst achieving net zero is crucial, we argue the path taken to get there is equally as important.

If we pour CO2 into the atmosphere faster than nature drains it out, the planet warms. Right now, the tap is open way too far. The most effective solution would be to decrease the flow into the bath while simultaneously increasing the outflow, but with carbon capture and storage still in its infancy (and negative emissions still a pipe dream for most companies), it’s simply not prudent to rely on future technological innovations. Our focus should instead be turned to limiting the flow rate of the tap.
“With carbon capture and storage still in its infancy (and negative emissions still a pipe dream for most companies), it’s simply not prudent to rely on future technological innovations.”
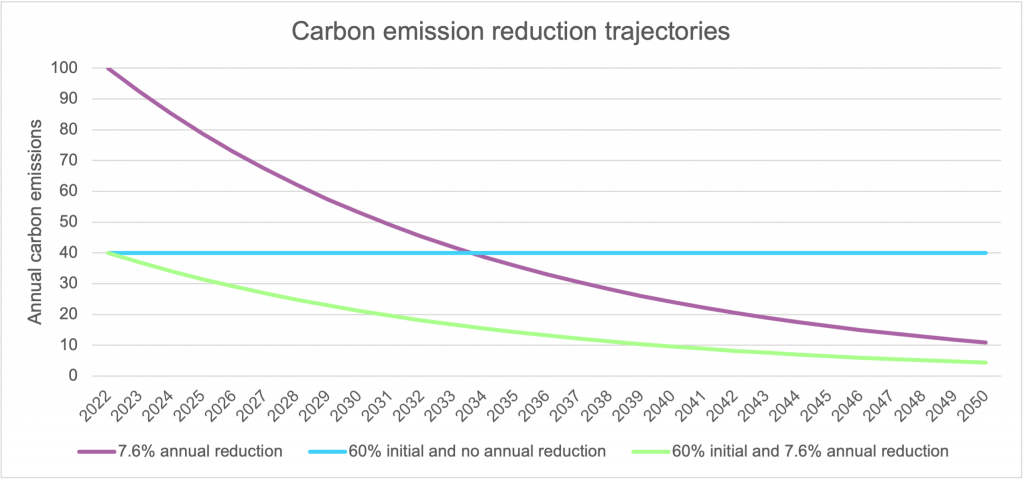
If we remain at today’s annual emissions levels some estimates suggest that we will exceed our carbon budget in the next five to ten years. Given this urgency, governments, corporates, and investors across the globe are at best setting and at worst communicating (ambitious) emission reduction targets, with a goal of achieving net zero by 2050. This focus on annual emission reductions is commendable however we argue that the area beneath this reduction curve (as shown in Figure 2) is what’s going to demonstrate the real carbon impact on the climate. This area represents the total cumulative emissions or, returning to the bath analogy, the volume of water that is contributing to the remaining carbon budget. The cumulative effect of CO2 emissions implies that a significantly heavier weight should be attached to current as opposed to future reductions.
“The cumulative effect of CO2 emissions implies that a significantly heavier weight should be attached to current as opposed to future emissions.”
Annual Carbon Emissions over time
Figure 2 below shows three trajectories. Firstly, the annual carbon emissions for a 7.6% reduction scenario (purple). Secondly, an immediate 60% reduction (blue), and finally an immediate 60% reduction followed by a 7.6% year-on-year reduction (green). By 2050, the line representing a 7.6% year-on-year reduction shows fewer annual emissions than an immediate reduction, and only slightly more than a 60% reduction followed by a 7.6% annual reduction. Viewing a snapshot of emissions in 2050 you could be fooled into thinking that future reduction promises are comparable, or even better than initial reductions. However, this does not tell the full story.

Cumulative Emissions
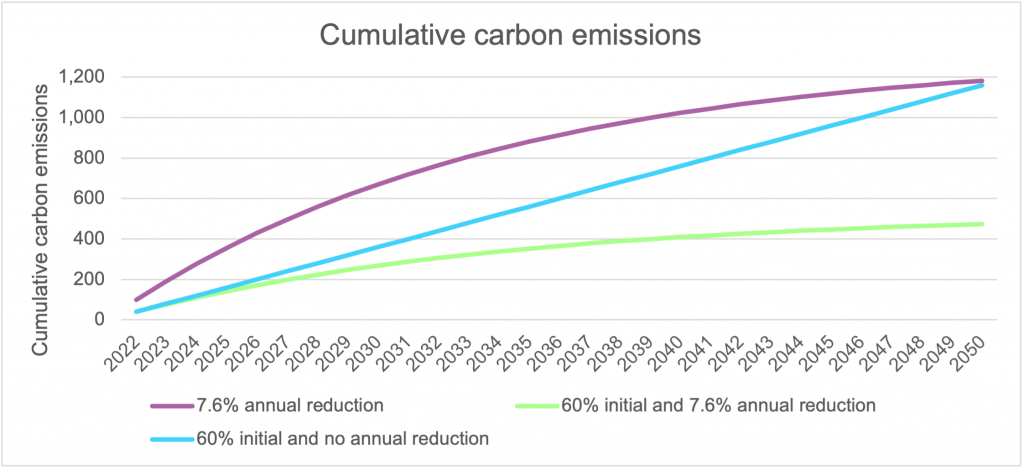
Figure 3 below illustrates the importance of the emission reduction path. If a 60% reduction is made now, then all that is needed to create lower cumulative emissions by 2050 is a 7.6% year-on-year reduction. Further, if we achieve a 60% reduction immediately and this is followed by a 7.6% reduction year on year, we see under half the cumulative carbon emissions by 2050. Clearly, a larger initial reduction will require a smaller year-on-year change to reach the same carbon budget. A carbon reduction now is worth more than a carbon reduction in the future.

The graphs above show that a 7.6% year-on-year future environmental saving is no replacement for realising these reductions now. As the old adage goes ‘The best time to invest was yesterday, the second-best time is now’. This rings especially true for environmental savings: the earlier these savings can be made, the better.
This document was prepared and issued by Osmosis Investment Research Solutions Limited (“OIRS”). OIRS is an affiliate of Osmosis Investment Management US LLC (regulated in the US by the SEC) and Osmosis Investment Management UK Limited (regulated in the UK by the FCA). OIRS and these affiliated companies are wholly owned by Osmosis (Holdings) Limited (“Osmosis”), a UK based financial services group. Osmosis has been operating its Model of Resource Efficiency since 2011.
[1] https://unfccc.int/news/cut-global-emissions-by-76-percent-every-year-for-next-decade-to-meet-15degc-paris-target-un-report


