Quarterly Investment Review and Outlook – June 30, 2024
By Robbie Parker CFA*, Chief Investment Officer
On the face of it, everything looks rosy in the equity markets – year to date (YTD) (end June-24), the S&P500 is up 15.3% (USD TR), Euro Stoxx 50 is up 11.2% (EUR TR) and the Nikkei 225 has rallied 19.3% (JPY TR) – but a look under the hood suggests not all is as it seems.
The Japanese Yen has continued its demise as it trades 14% weaker against the US Dollar, starting the year at 141 and finishing at 161. Attributing the 12% MSCI World returns YTD using the BARRA GEMLT model, the equity market factor contributed only 53% of the total return. The second largest contribution comes from the idiosyncratic / stock specific factor, which contributed 32%. This is very large given the scale of return, highlighting that single stock concentration continues to dominate.
Unsurprisingly, the usual suspects contributed most heavily to the total return of the MSCI world. Nvidia contributed 3.1% alone whilst the next top nine contributors delivered 4.5% (Microsoft, Amazon, Meta, Eli Lilly, Alphabet, Apple, Broadcom, Novo Nordisk, ASML). The main drivers of return are attributable to the US market and are heavily focused in the large cap names.
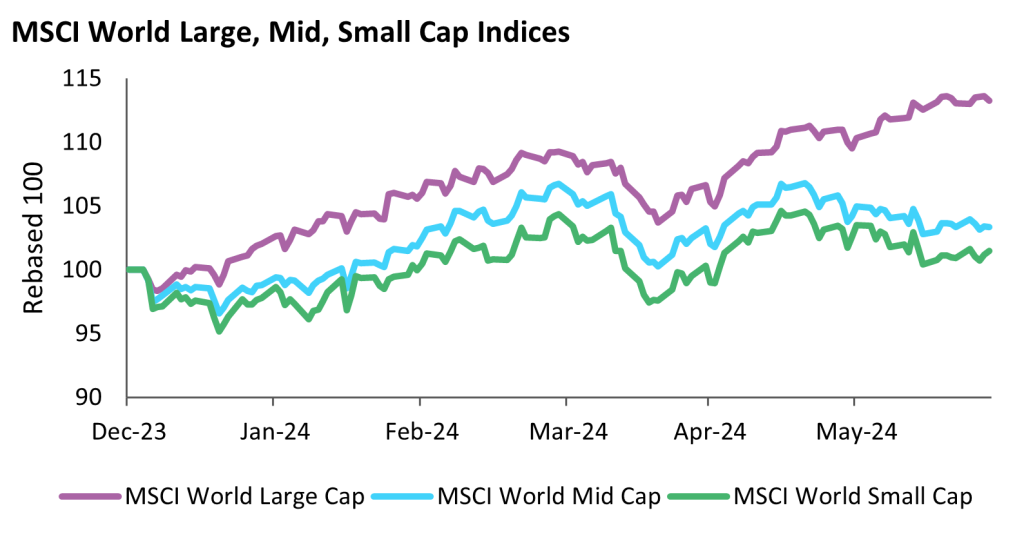
Figure 1: Source: Bloomberg, Osmosis IM (30 June 2024) (Tickers: M1WOLC, M1WOMC, NCUDWI)
Whilst interest rates remain at elevated levels, the forward curve remains downward sloping, albeit US treasuries bottom out at the 5-yr with yields above 4.2%. This is a far cry from the previous record highs seen at the end of 2021 when yields were a paltry 1.5%. Of course, AI-mania was not really on the horizon by this point, but it is clear to see how thin this rally continues to be!
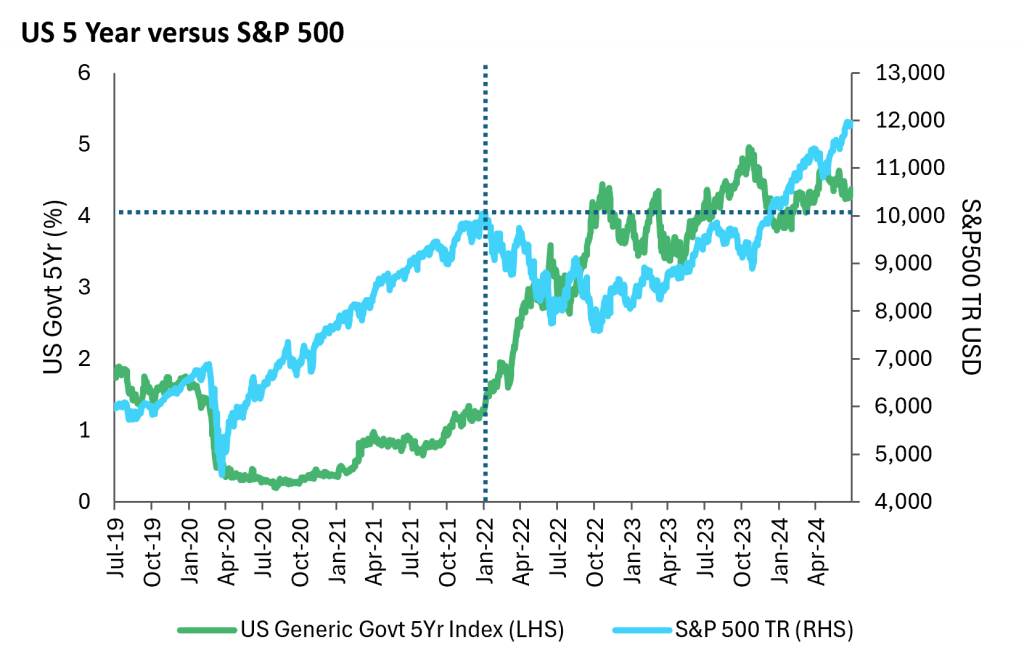
Figure 2: Source: Bloomberg, Osmosis IM (June 2024)
The lag in green/environmental solution companies since the end of December 2021 continues, highlighting that the majority of sectors cannot easily shrug off the impact of higher rates. Despite the Environmental Technologies (ET100 index) absolute rise of 11.00% YTD, it remains significantly behind that of the MSCI World (figure 3). The market continues to ignore climate risk, yet the backdrop of climate disasters continues unabated. Last year, the US experienced 28 separate weather and climate disasters costing at least $1bn – a record-breaking year. This year, there have already been 11 separate events, including the earliest ever category 5 hurricane which battered the Caribbean recently.
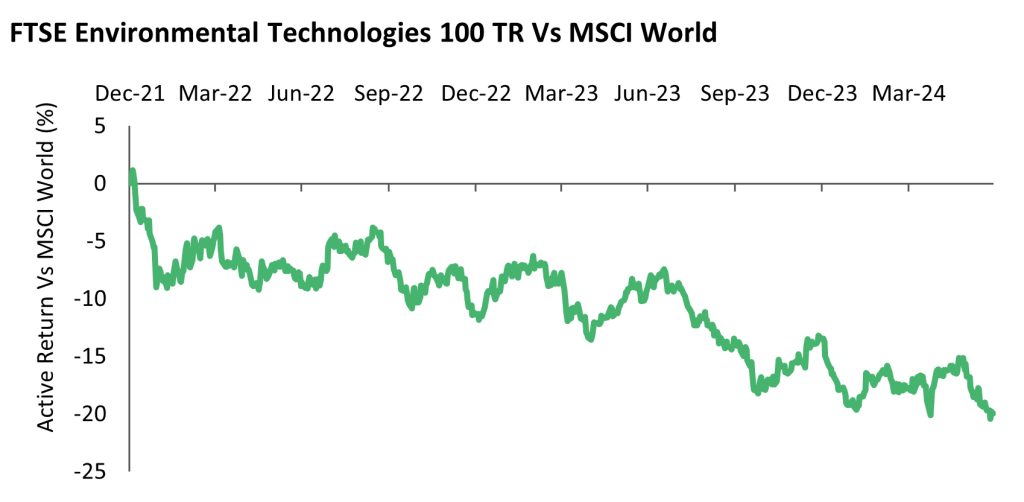
Figure 3: Source Bloomberg, MSCI, Osmosis IM (June 2024)
June was also one of the warmest months on record. More than 100 million people in the US were exposed to extreme heat, whilst India is experiencing its longest heatwave ever. Over 1,300 people died during the Hajj pilgrimage in Saudi Arabia due to temperatures levels of over 40° Celsius. Meanwhile, the ongoing mega-drought in East Africa (since 2020) has led to substantial harvest failure, poor pasture conditions, livestock losses, decreased surface water availability and human conflicts, leaving 4.35 million people in need of humanitarian assistance. Unfortunately, the political backdrop is unsupportive. The recent EU elections pushed heavily to the right, raising concerns that sympathies lie more with Russian and Middle Eastern gas than with potential home-grown, green energy solutions. As can be seen from Figure 4 below, the EU Emissions Trading System (ETS) scheme has fallen from encouraging highs to low levels aligned with those witnessed during 2021.
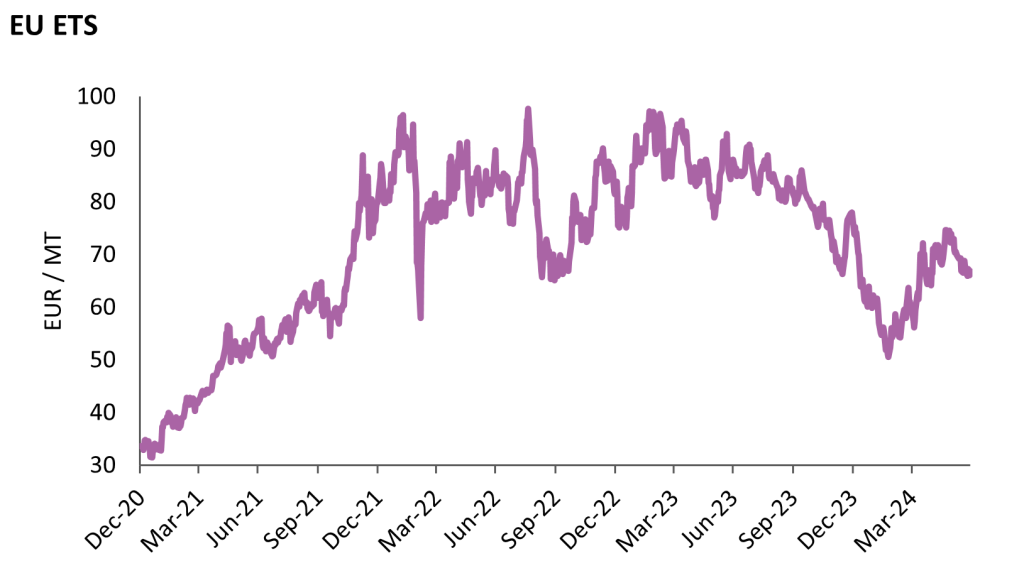
Figure 4: Source Bloomberg, MSCI, Osmosis IM (June 2024)
US politics, meanwhile, is hardly inspiring a future based on long-termism. As it stands, either Trump or Biden could become the oldest president ever. Whilst Trump is all but a certainty for the Republican candidacy, for the future of the energy transition, we can only hope for another candidate to come forward for the Democratic party. A candidate capable of uniting a more global push for action on climate change.
Whilst the developed economies dispute the merits of the transition, we see progress in emerging economies. China recently proposed a unified national carbon footprint management system and in tandem, during FY2023, it invested an estimated US$890bn in the clean-energy sector. After ousting Bolsonaro, Brazil has reengaged on environmental protection measures and alongside Thailand and Indonesia, have introduced strong electric vehicle incentive schemes.
New technologies remain volatile. However, we can show that the economic rationale behind the sustainable transition is as pertinent as ever. Companies that have reduced their use of carbon, water, and waste intensities, and thus become more Resource Efficient than their same sector peers, have (according to our research) continued to generate strong fundamental characteristics, such as greater profitability and lower leverage on a yearly basis.
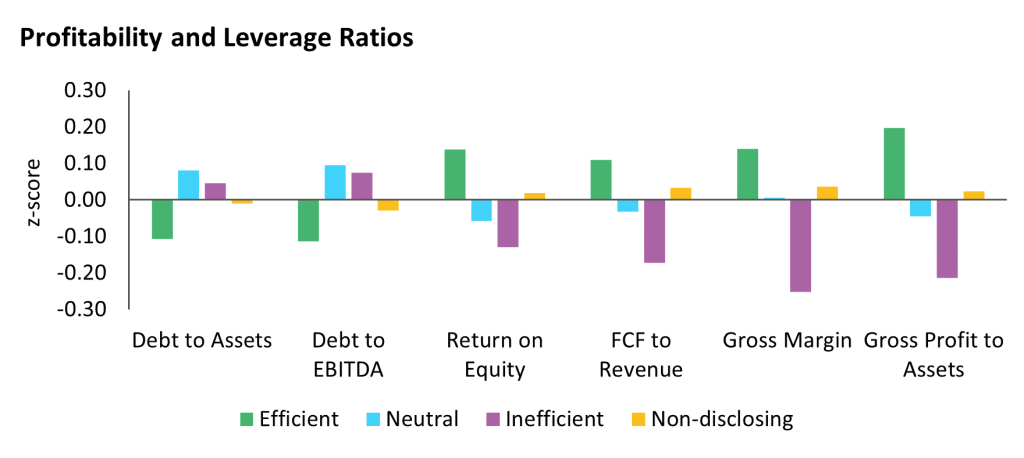
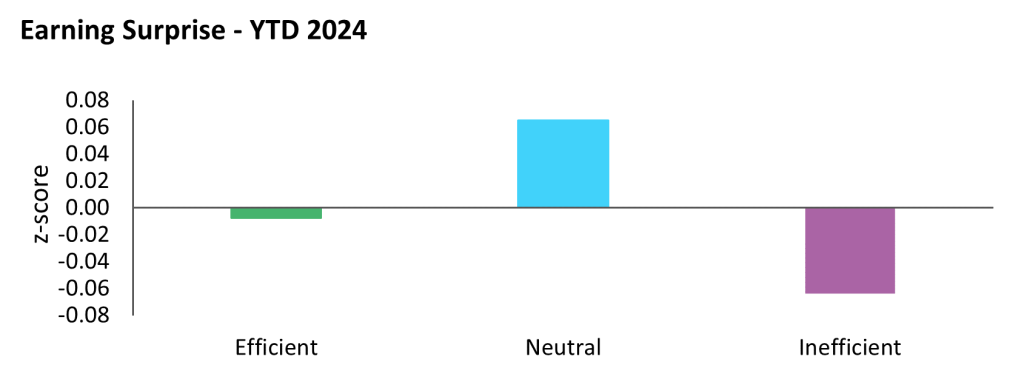
Figures 5 and 6: Source Bloomberg, MSCI, Osmosis IM (June 2024)
YTD, we have also seen Resource Inefficient companies delivering negative earning surprises (see figure 6 above) relative to analyst estimates. The Neutral portion had positive earnings, whilst the Resource Efficient companies came in at the expected levels.
Whilst there remains much to be negative about, we are optimistic that the headwinds will change. Natural resources are intrinsic to the balance sheet and ultimately, economics will drive the flow of capital to those firms that are better prepared. Unfortunately, with no political backing, the cost and pain of the required transition will continue to rise.
Osmosis or any of its affiliates does not make any representation or warranty, express or implied, as to the accuracy or completeness of the information contained in this document and nothing contained in this document should be relied upon as a promise or representation of any future performance of any Osmosis client or any other entity. Past performance is not indicative of any future results. Certain information has not been independently verified but was obtained from third-party sources believed to be reliable. Osmosis does not undertake any obligation to update any of the information contained herein or to correct any inaccuracies. It should not be assumed that investment recommendations in the future will be profitable.
*The Chartered Financial Analyst (“CFA”) designation is issued by the CFA Institute. CFA candidates must meet one of the following requirements: (1) undergraduate degree and four years of professional experience involving investment decision-making, or (2) four years qualified work experience (full time, but not necessarily investment- related). To receive the CFA designation, candidates must complete the CFA Program which is organized into three levels, each requiring 250 hours of self-study and each culminating in a six-hour exam. There are no ongoing continuing education or experience thresholds necessary to maintain the CFA designation. More information about the designation is available at https://www.cfainstitute.org.


