Scope 3 disclosures* often raise more questions than they can answer. A recent attempt by green poster child Tesla to report on Scope 3 emissions of its Model 3 in China (its second-largest market) is a little publicised but poignant example of this.
On scouring Tesla’s latest impact report, our team of analysts found that the company had chosen to base their emissions assumptions for China on data from the province of Sichuan.
The choice of Sichuan was, of course deliberate, and clever. It’s a scope 3 trick of the trade, which is by no means exclusive to Tesla.
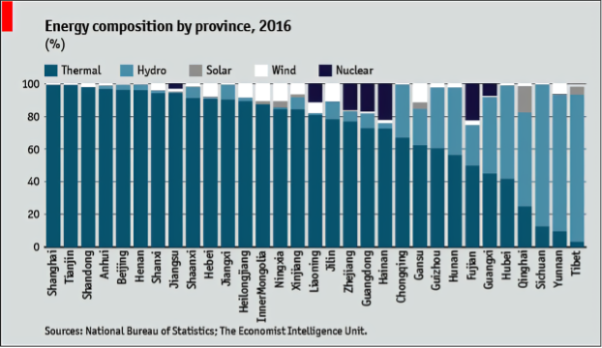
Sichuan’s energy grid is one of the cleanest in China, and some 87% of its electricity is generated from hydropower sources. Let’s face it, the heavily polluted city of Shanghai, where Tesla’s own Gigafactory is located, was a far less attractive proposition. Energy in Shanghai is almost entirely derived from thermal generation, making it the most carbon-intensive province in China. (See graph below)

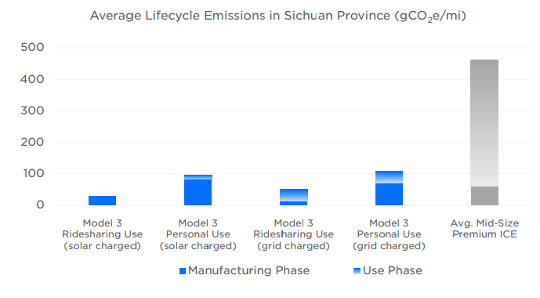
The underlying assumptions used by companies to model their scope 3 emissions can heavily impact the final figure and thus change how green the company appears to be. Assuming consumers will charge their cars in Sichuan rather than in Shanghai will reduce use-phase emissions drastically. Tesla’s estimation for the average lifecycle emissions of a Model 3 charged through the Sichuan grid comes in at ~100 gCO2e per mile. Recalculating this figure using the average grid intensity of China as a whole, a figure closer to ~ 300 gCO2e per mile is obtained. Using the car in some of the more intensive provinces, like Shanghai or Tianjin, would lead to even higher numbers, likely surpassing Tesla’s estimate for an average conventional car (~450gCO2e per mile).

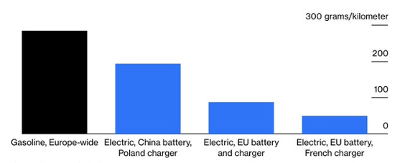
This point is highlighted in the graph below, which shows that the emissions savings of an electric vehicle depend heavily on whether it’s charged in a low emissions grid or a high emissions one.

An industry-wide problem
Tesla is not the only company optimising the underlying assumptions of their scope 3 figures to achieve an optically more pleasing result. A lack of standards with regard to scope 3 reporting makes meaningful analysis of such figures difficult without the necessary tools to interpret them.
Our research shows that most conventional car companies will estimate their scope 3 emissions using a variation of the following formula: multiplying their annual sales figure with an average lifetime travel distance (in kilometres), multiplied by an average fuel consumption figure or CO2e emission factor. Almost no company is fully transparent on the exact figures used in this calculation.
While Volkswagen, Daimler and Volvo Cars use 200,000km as lifetime distance per car, GM, Ford, and Renault use 150,000km and Suzuki only 130,000km. In most cases, it is assumed that all sales are included in these calculations. However, both BMW and Toyota figures are based on sales in certain regions, totalling between 80-90% of total sales. Piaggio, on the other hand, the manufacturer of the famous Vespa scooters, discloses a total use-phase emissions figure solely based on their best-selling products. Lastly, while manufacturers claim that the average CO2 emission figure per car is transparent and defined by law, the Volkswagen emission scandal continues to cast doubt over the accuracy of these figures.
Consequentially how these companies are viewed/scored in any environmental model that relies on the inclusion of scope 3 data should be treated with a measure of caution. With no clear standards or sector uniformity, most scope 3 data is based on different assumptions and, as such, will have a major impact/distortion on the final disclosed emission figure. While each company might believe their approach to be the correct one, the result is, in our opinion, an unusable set of figures, ill-suited to the needs of environmentally concerned investors.
What does this mean for investors?
Unfortunately, these practices present a big challenge for investors seeking to measure their exposure to Scope 3 emissions. Data is scarce, inconsistent, and heavily influenced by subjective decision making.
As became apparent in the auto manufacturing examples described above, even in an industry where use-phase emissions seem straightforward, the final emissions figure heavily depends on subjective assumptions made by the reporting company. A lack of transparency and objectivity surrounds a sector that makes its own decisions on where electric cars are charged, how many lifetime kilometres they drive and which fuel efficiency metric they incorporate. When these subjective assumptions creep into the portfolio construction process, it becomes impossible to maintain the efficacy of your investment signal.
Some third-party data vendors bypass this issue by overwriting self-disclosed scope 3 data and replacing it with their own estimated or modelled data. While it does remove the myriad of a company’s assumptions underlying the scope 3 data, it results in a dataset based purely on estimation models. It is completely detached from reality, often multiplying revenue with an industry-wide emission factor. While it can give you an idea of where emission hotspots may be located within a company’s value chain, it cannot give you any information regarding how well the company’s management is managing its climate impact.
It could, of course, be argued that some degree of measurement/estimation is better than none at all. Indeed few would dispute the importance of setting meaningful scope 3 reduction targets or the benefits of engaging with third-party suppliers to understand your scope 3 emissions better. But in line with the oft-quoted adage that “you can’t manage what you can’t measure,” we believe that being able to quantify a company’s scope 3 emissions is an essential starting point for effective – and responsible – investment management. So for those investors who believe that sustainability can provide a source of ongoing excess return, continuous and accurate measurement and reporting remains key. Simply integrating estimated scope 3 emissions, the bastion of greenwashed data, will bring in additional risk and unintended bets that will unlikely be rewarded.
*The GHG Protocol – the only internationally accepted method for companies to account for these types of emissions – defines scope 3 emissions as “all indirect emissions (not included in scope 2) that occur in the value chain of the reporting company, including both upstream and downstream emissions”.
Important Information
This document was prepared and issued by Osmosis Investment Research Solutions Limited (“OIRS”). OIRS is an affiliate of Osmosis Investment Management US LLC (regulated in the US by the SEC) and Osmosis Investment Management UK Limited (regulated in the UK by the FCA). OIRS and these affiliated companies are wholly owned by Osmosis (Holdings) Limited (“Osmosis”), a UK based financial services group. Osmosis has been operating its Model of Resource Efficiency since 2011.
The examples of specific investments described herein should not be considered a recommendation to buy or sell any specific securities. There can be no assurance that such investments will be purchased in a client’s portfolio. It should not be assumed that any of the investments identified in these case studies will be profitable in the future. Whilst the information contained herein is believed to be accurate, no representation or warranty, express or implied, is or will be made, and no responsibility or liability is or will be accepted by Osmosis, or by any of its officers, employees, or agents, in relation to the accuracy or completeness of this document or of any information contained within it.
All data points relating to the companies mentioned in this report have been sourced from the most recent and publicly available corporate sustainability reports.
Any views expressed are those of Osmosis only and should not be construed as investment advice or in any way recommending a specific security.
Osmosis Investment Research Solutions Limited (CRN 09935396)


